


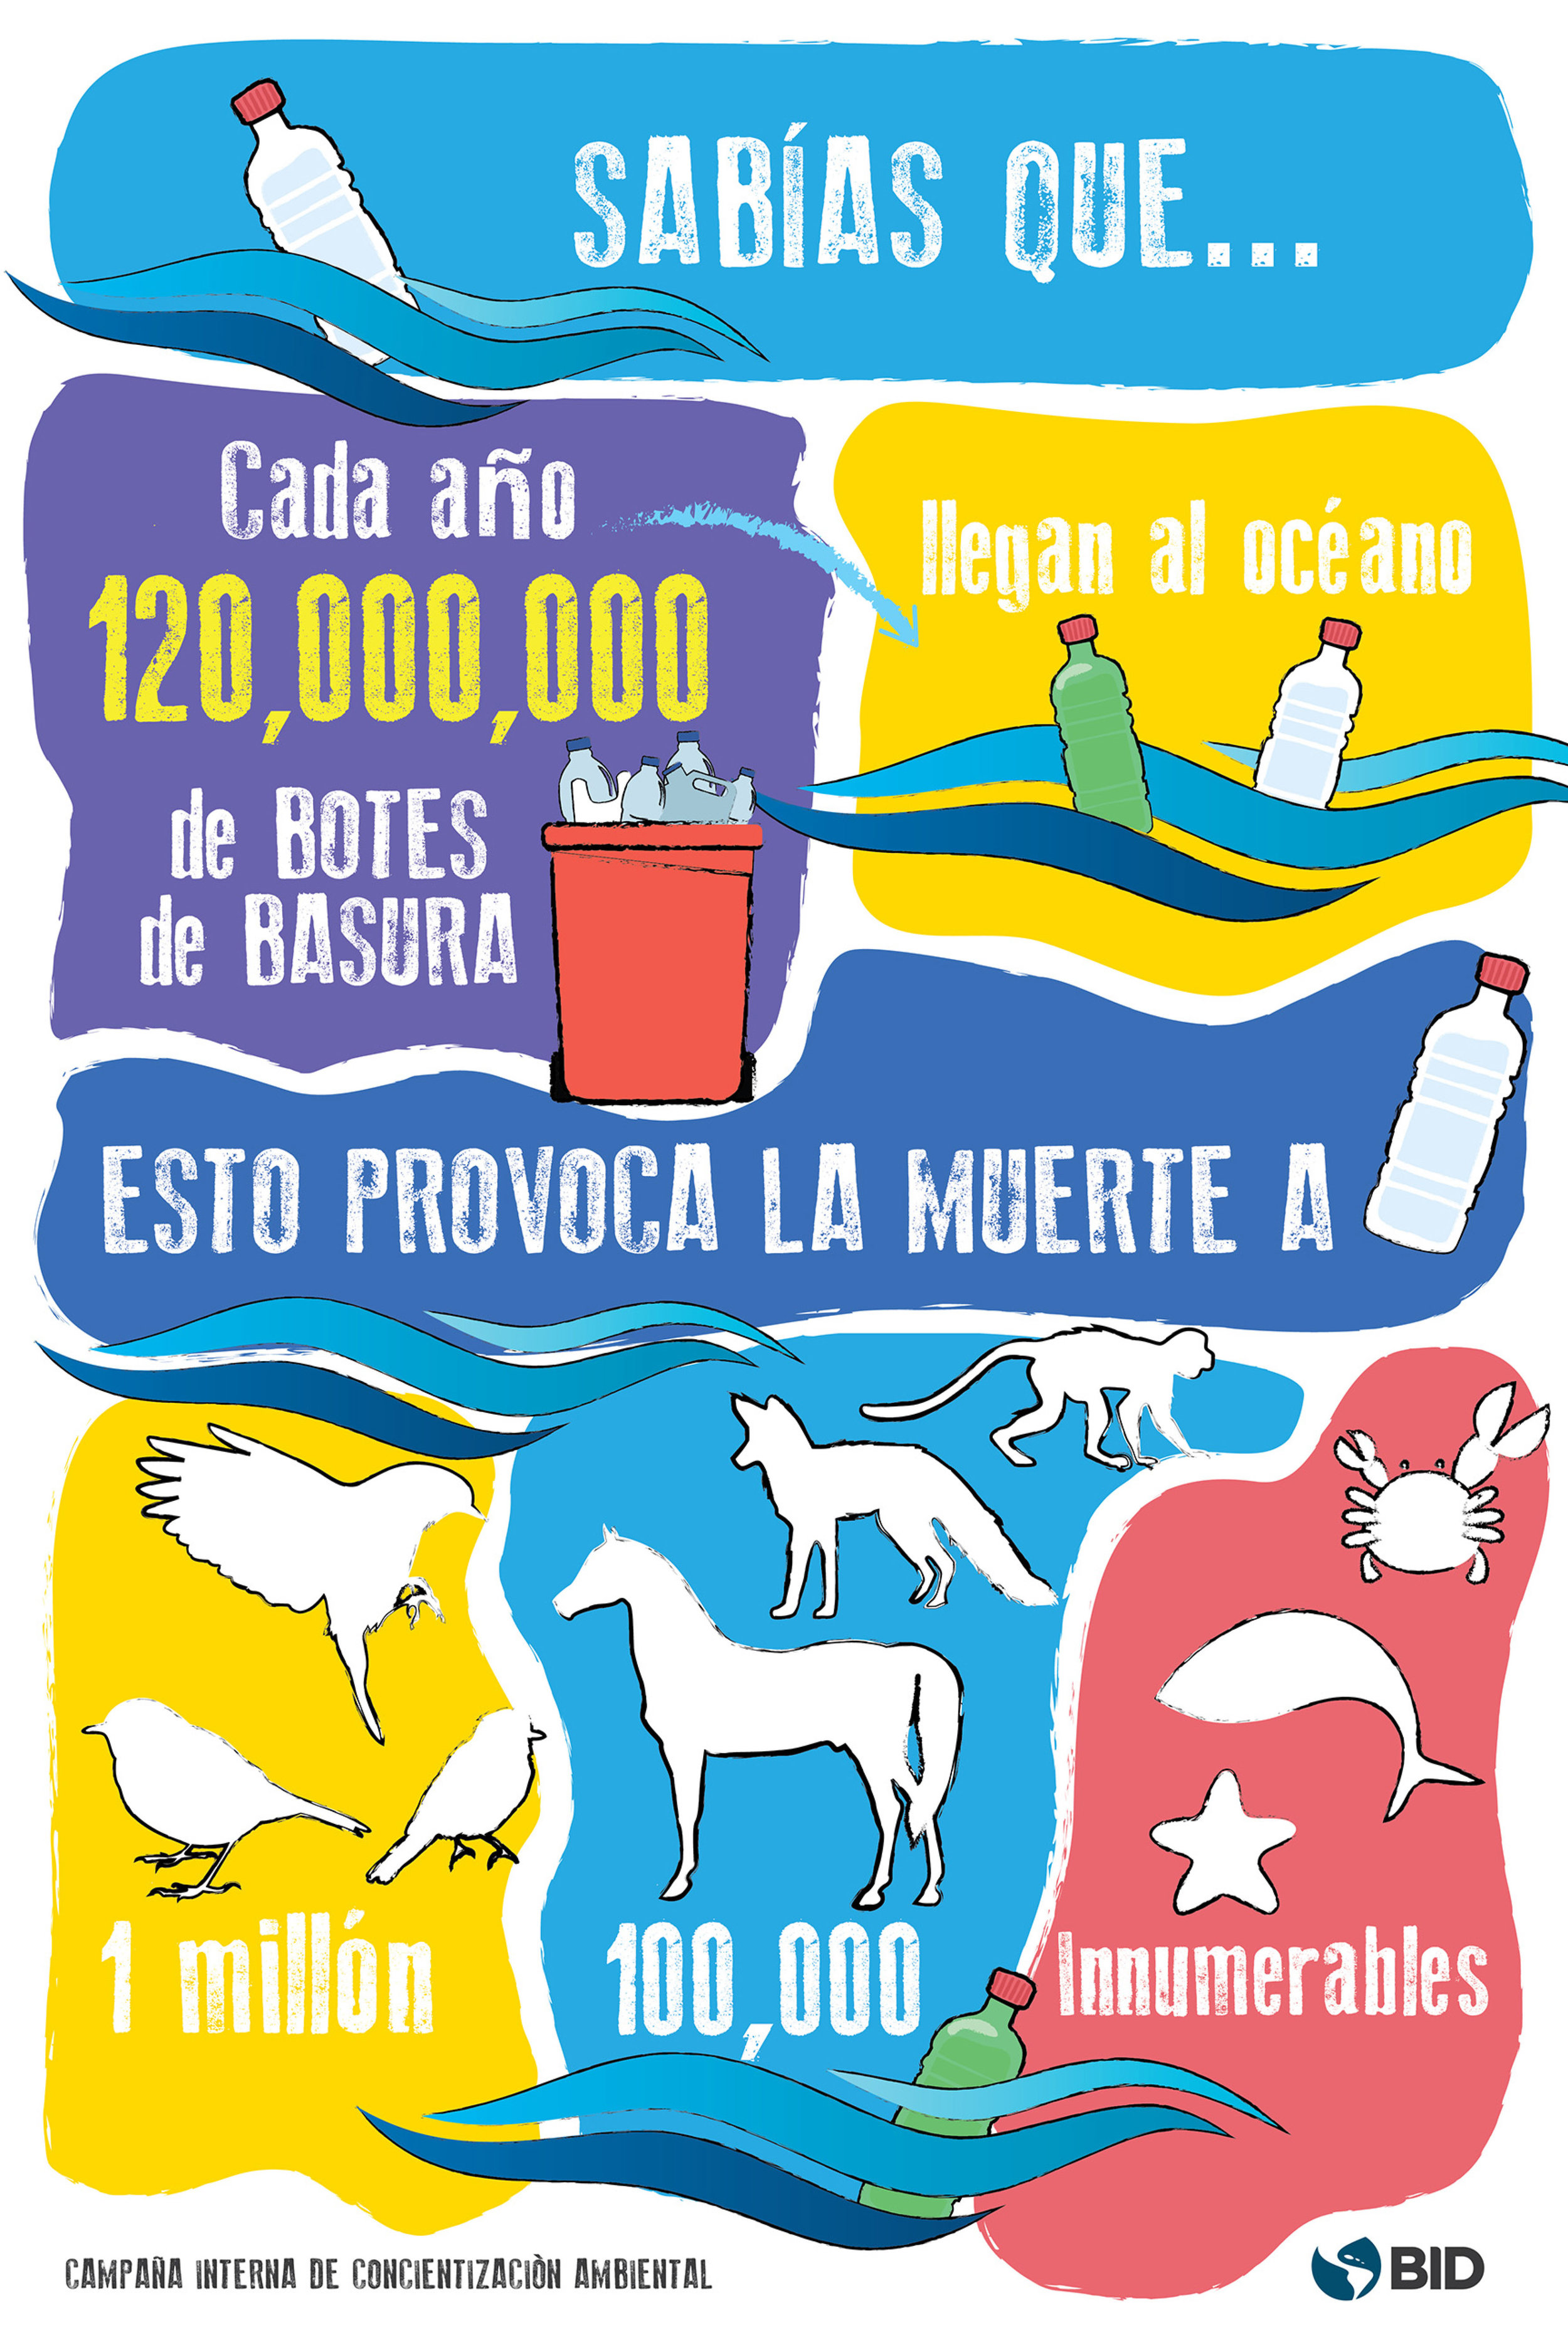
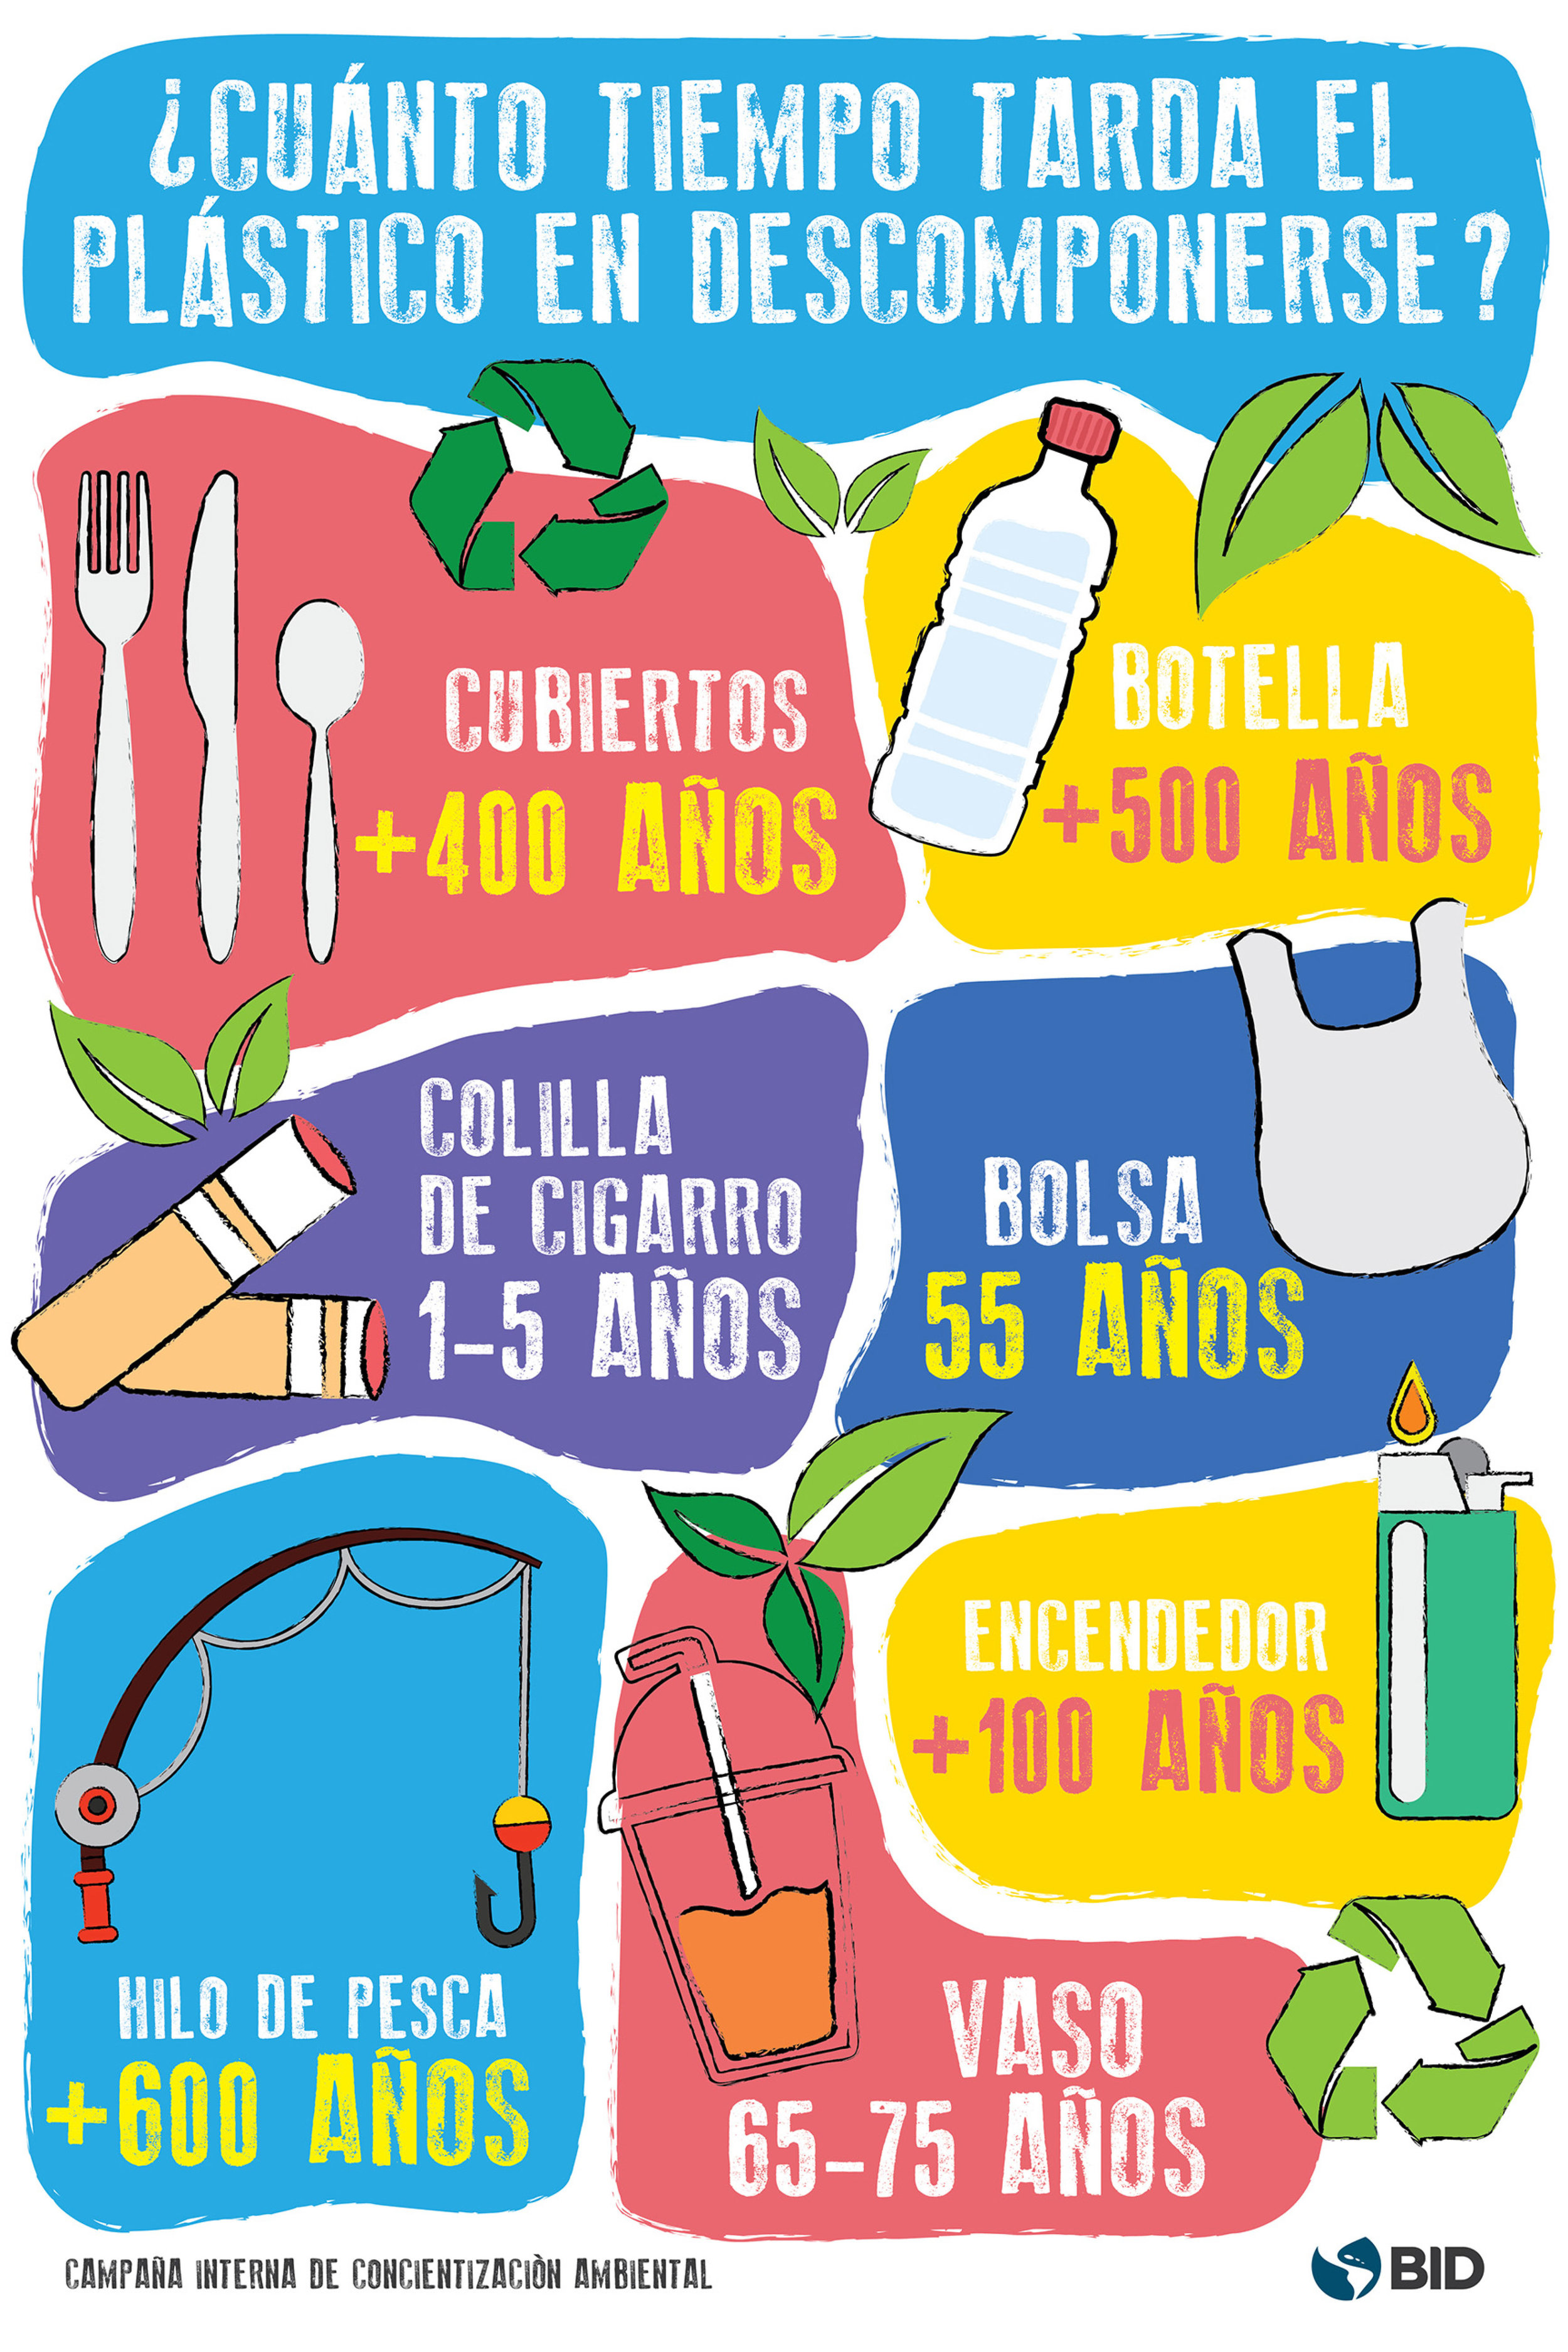
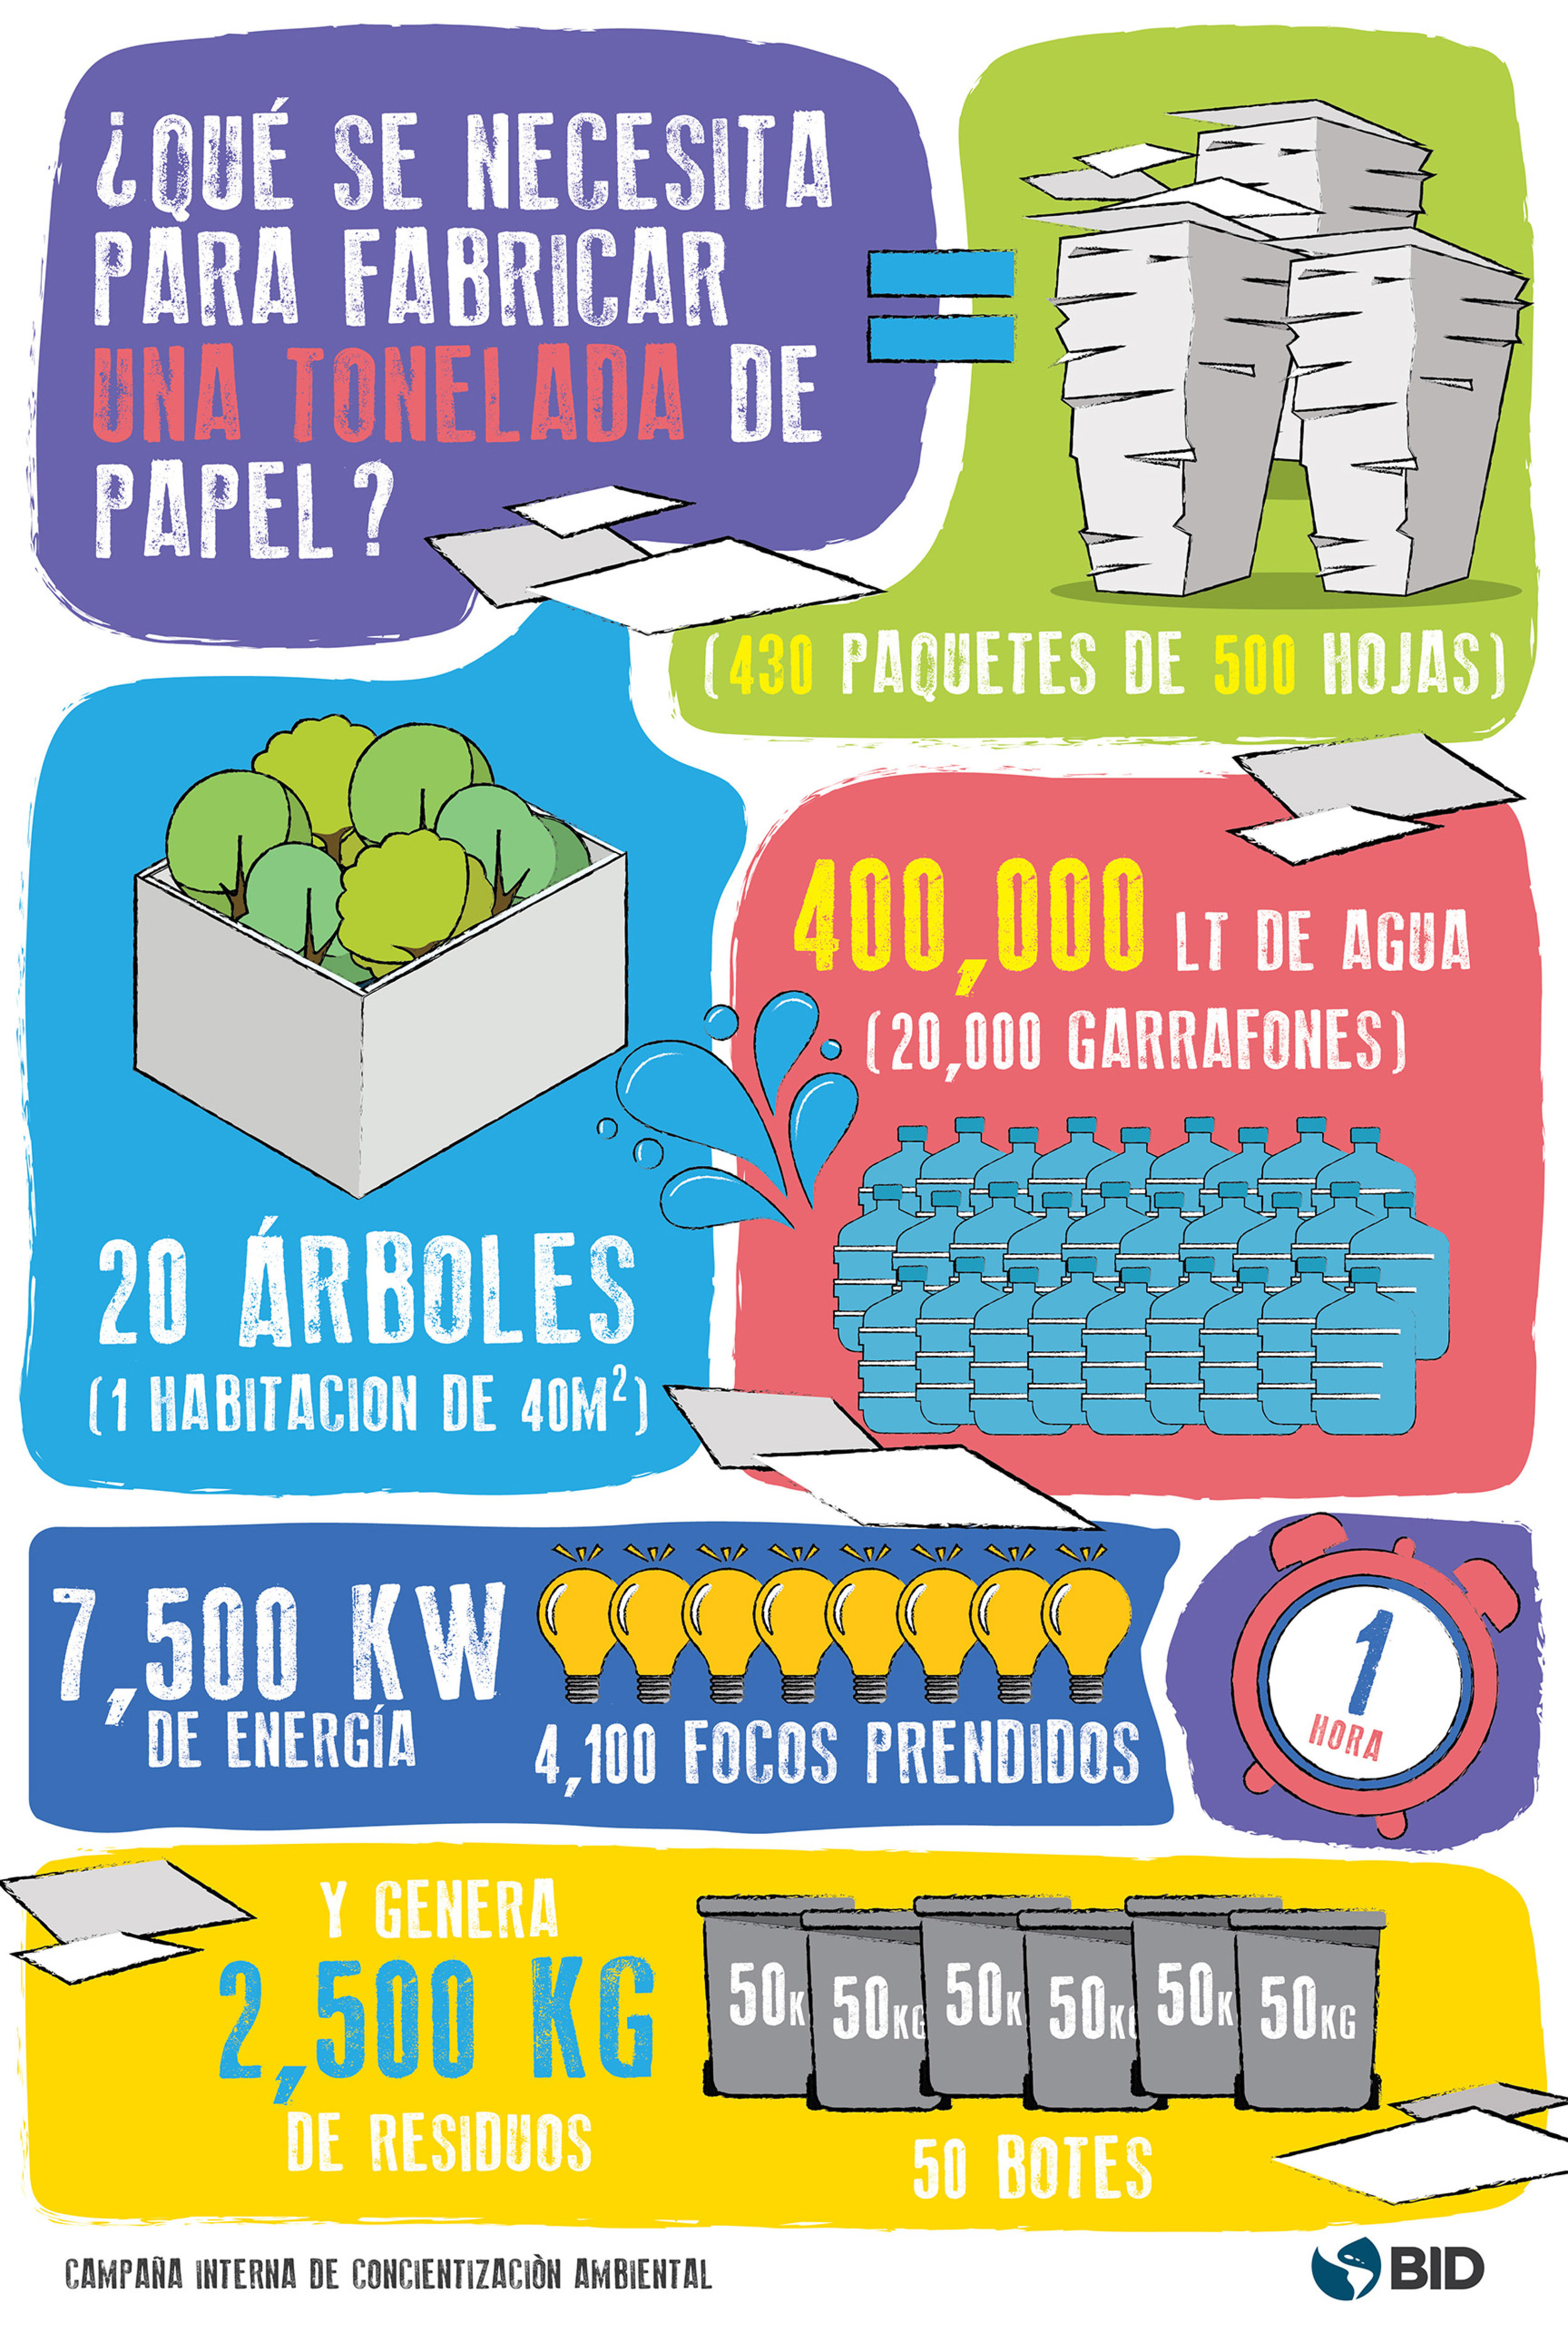
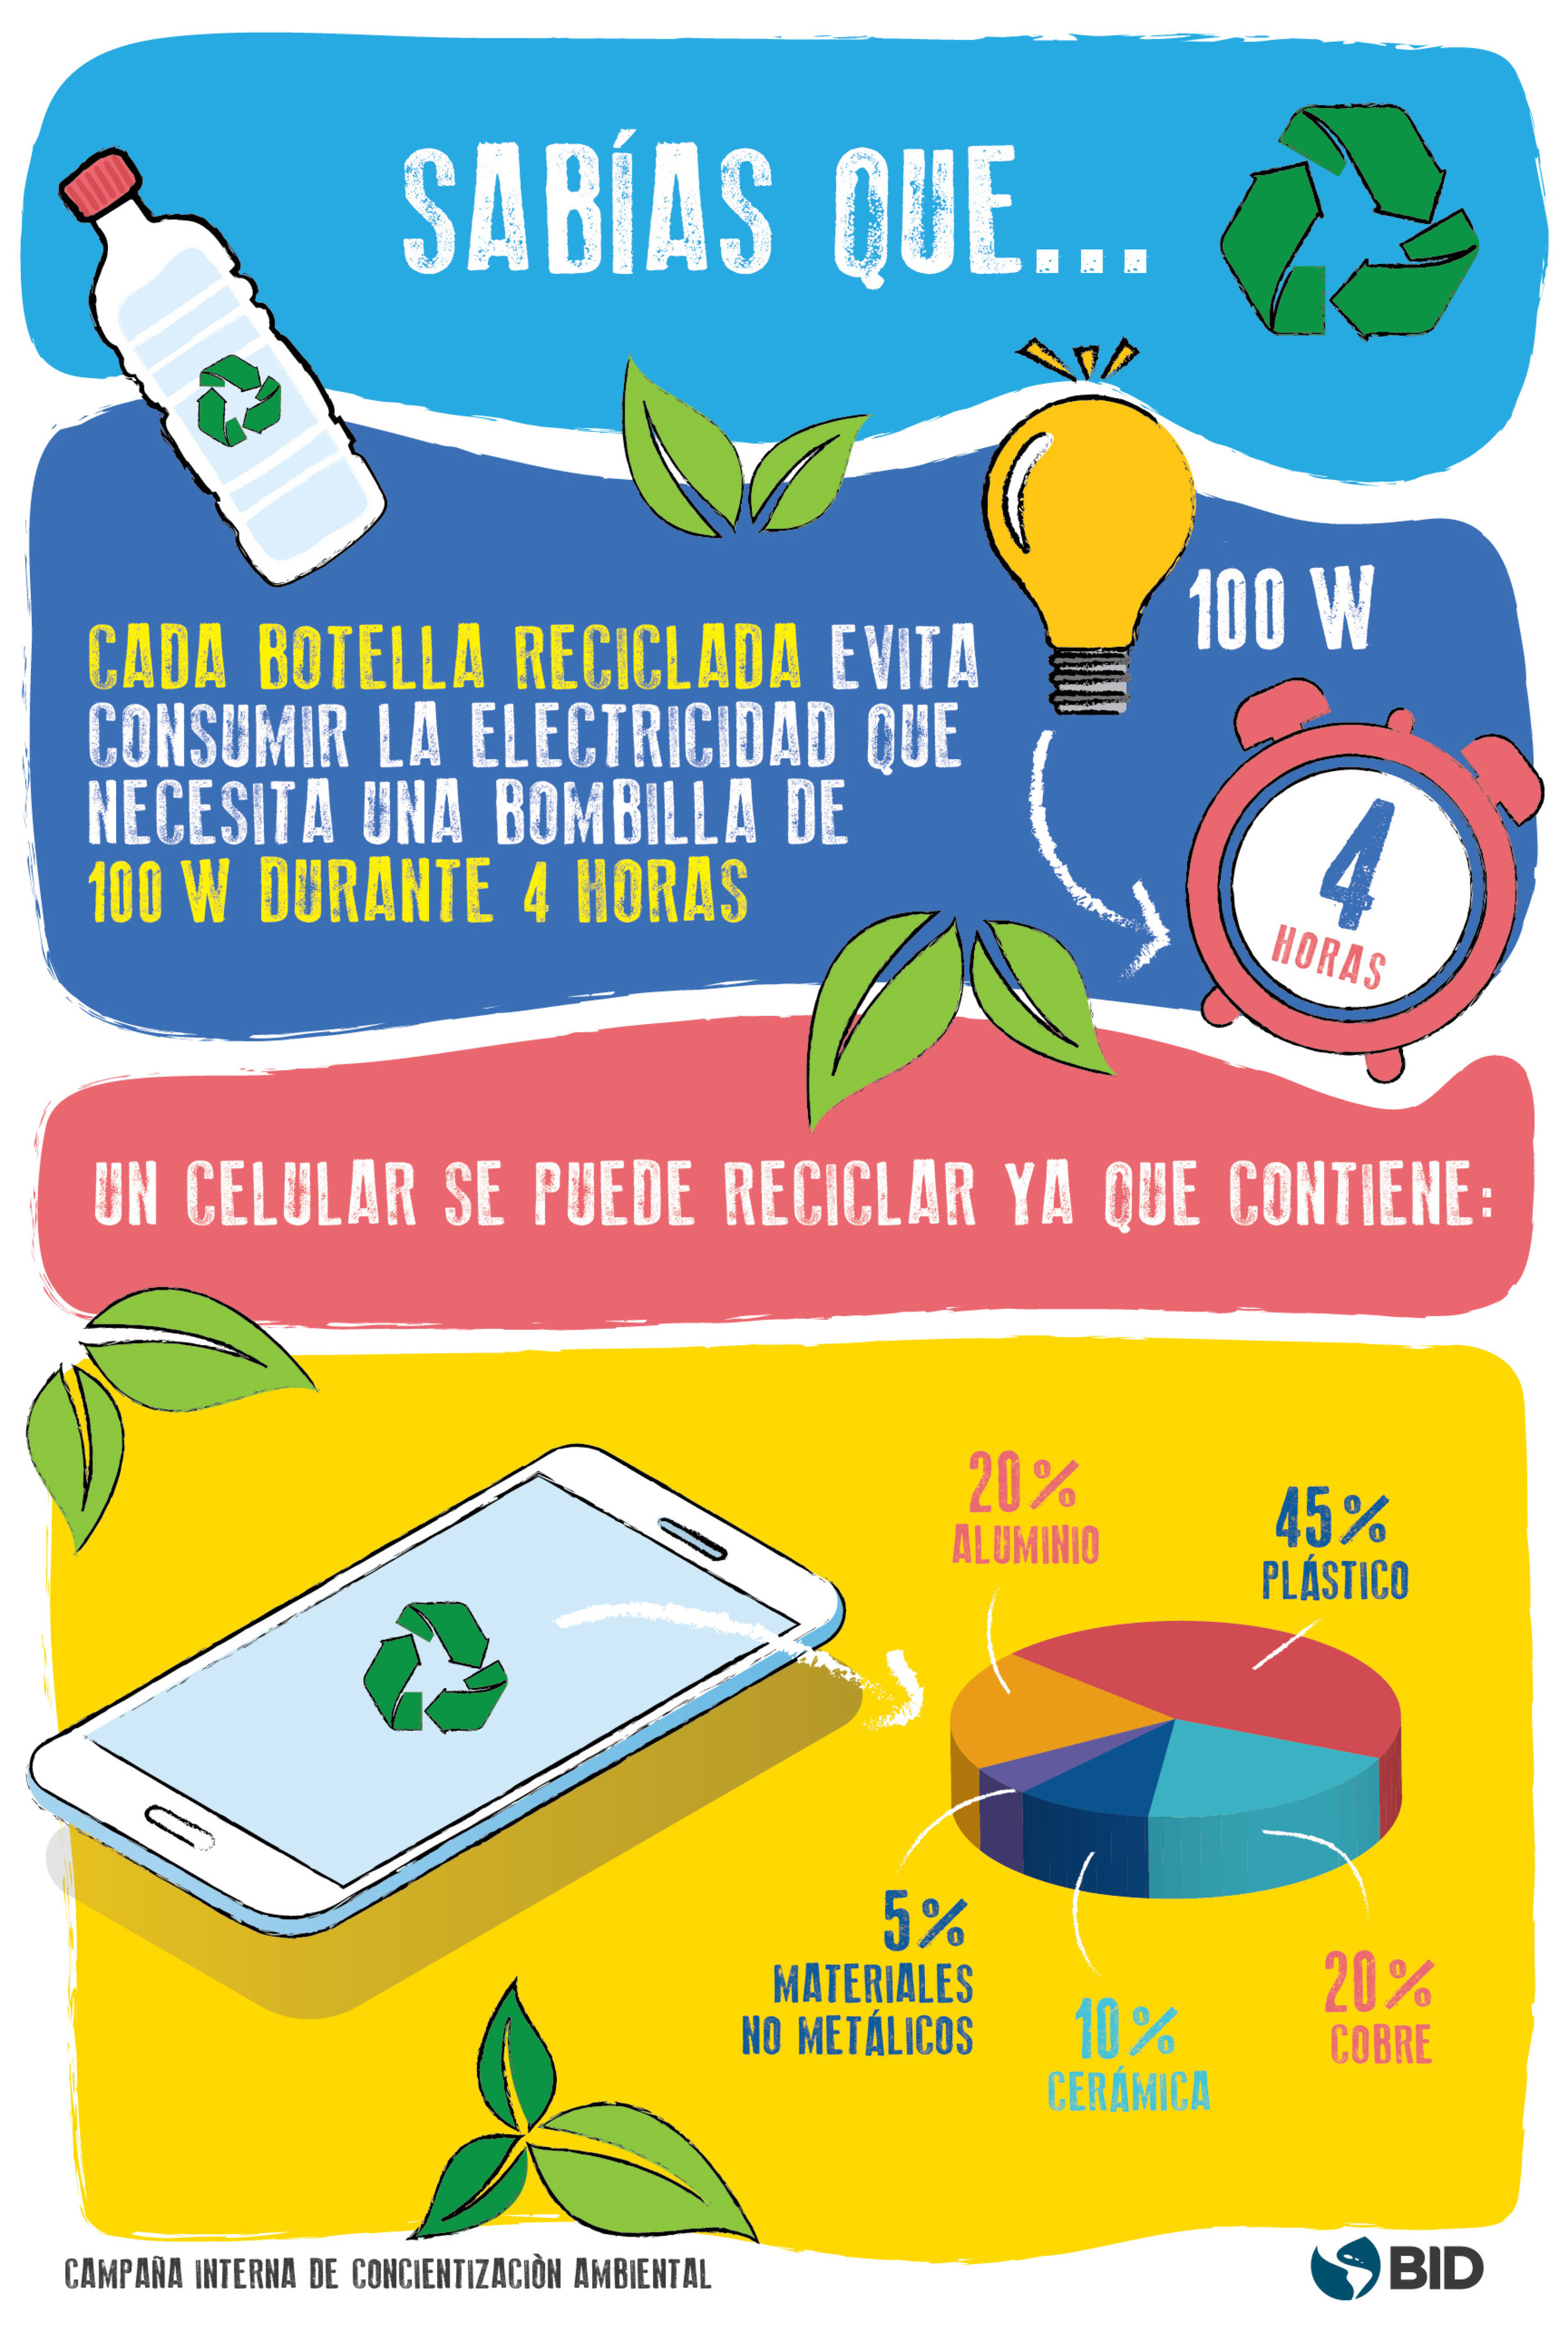
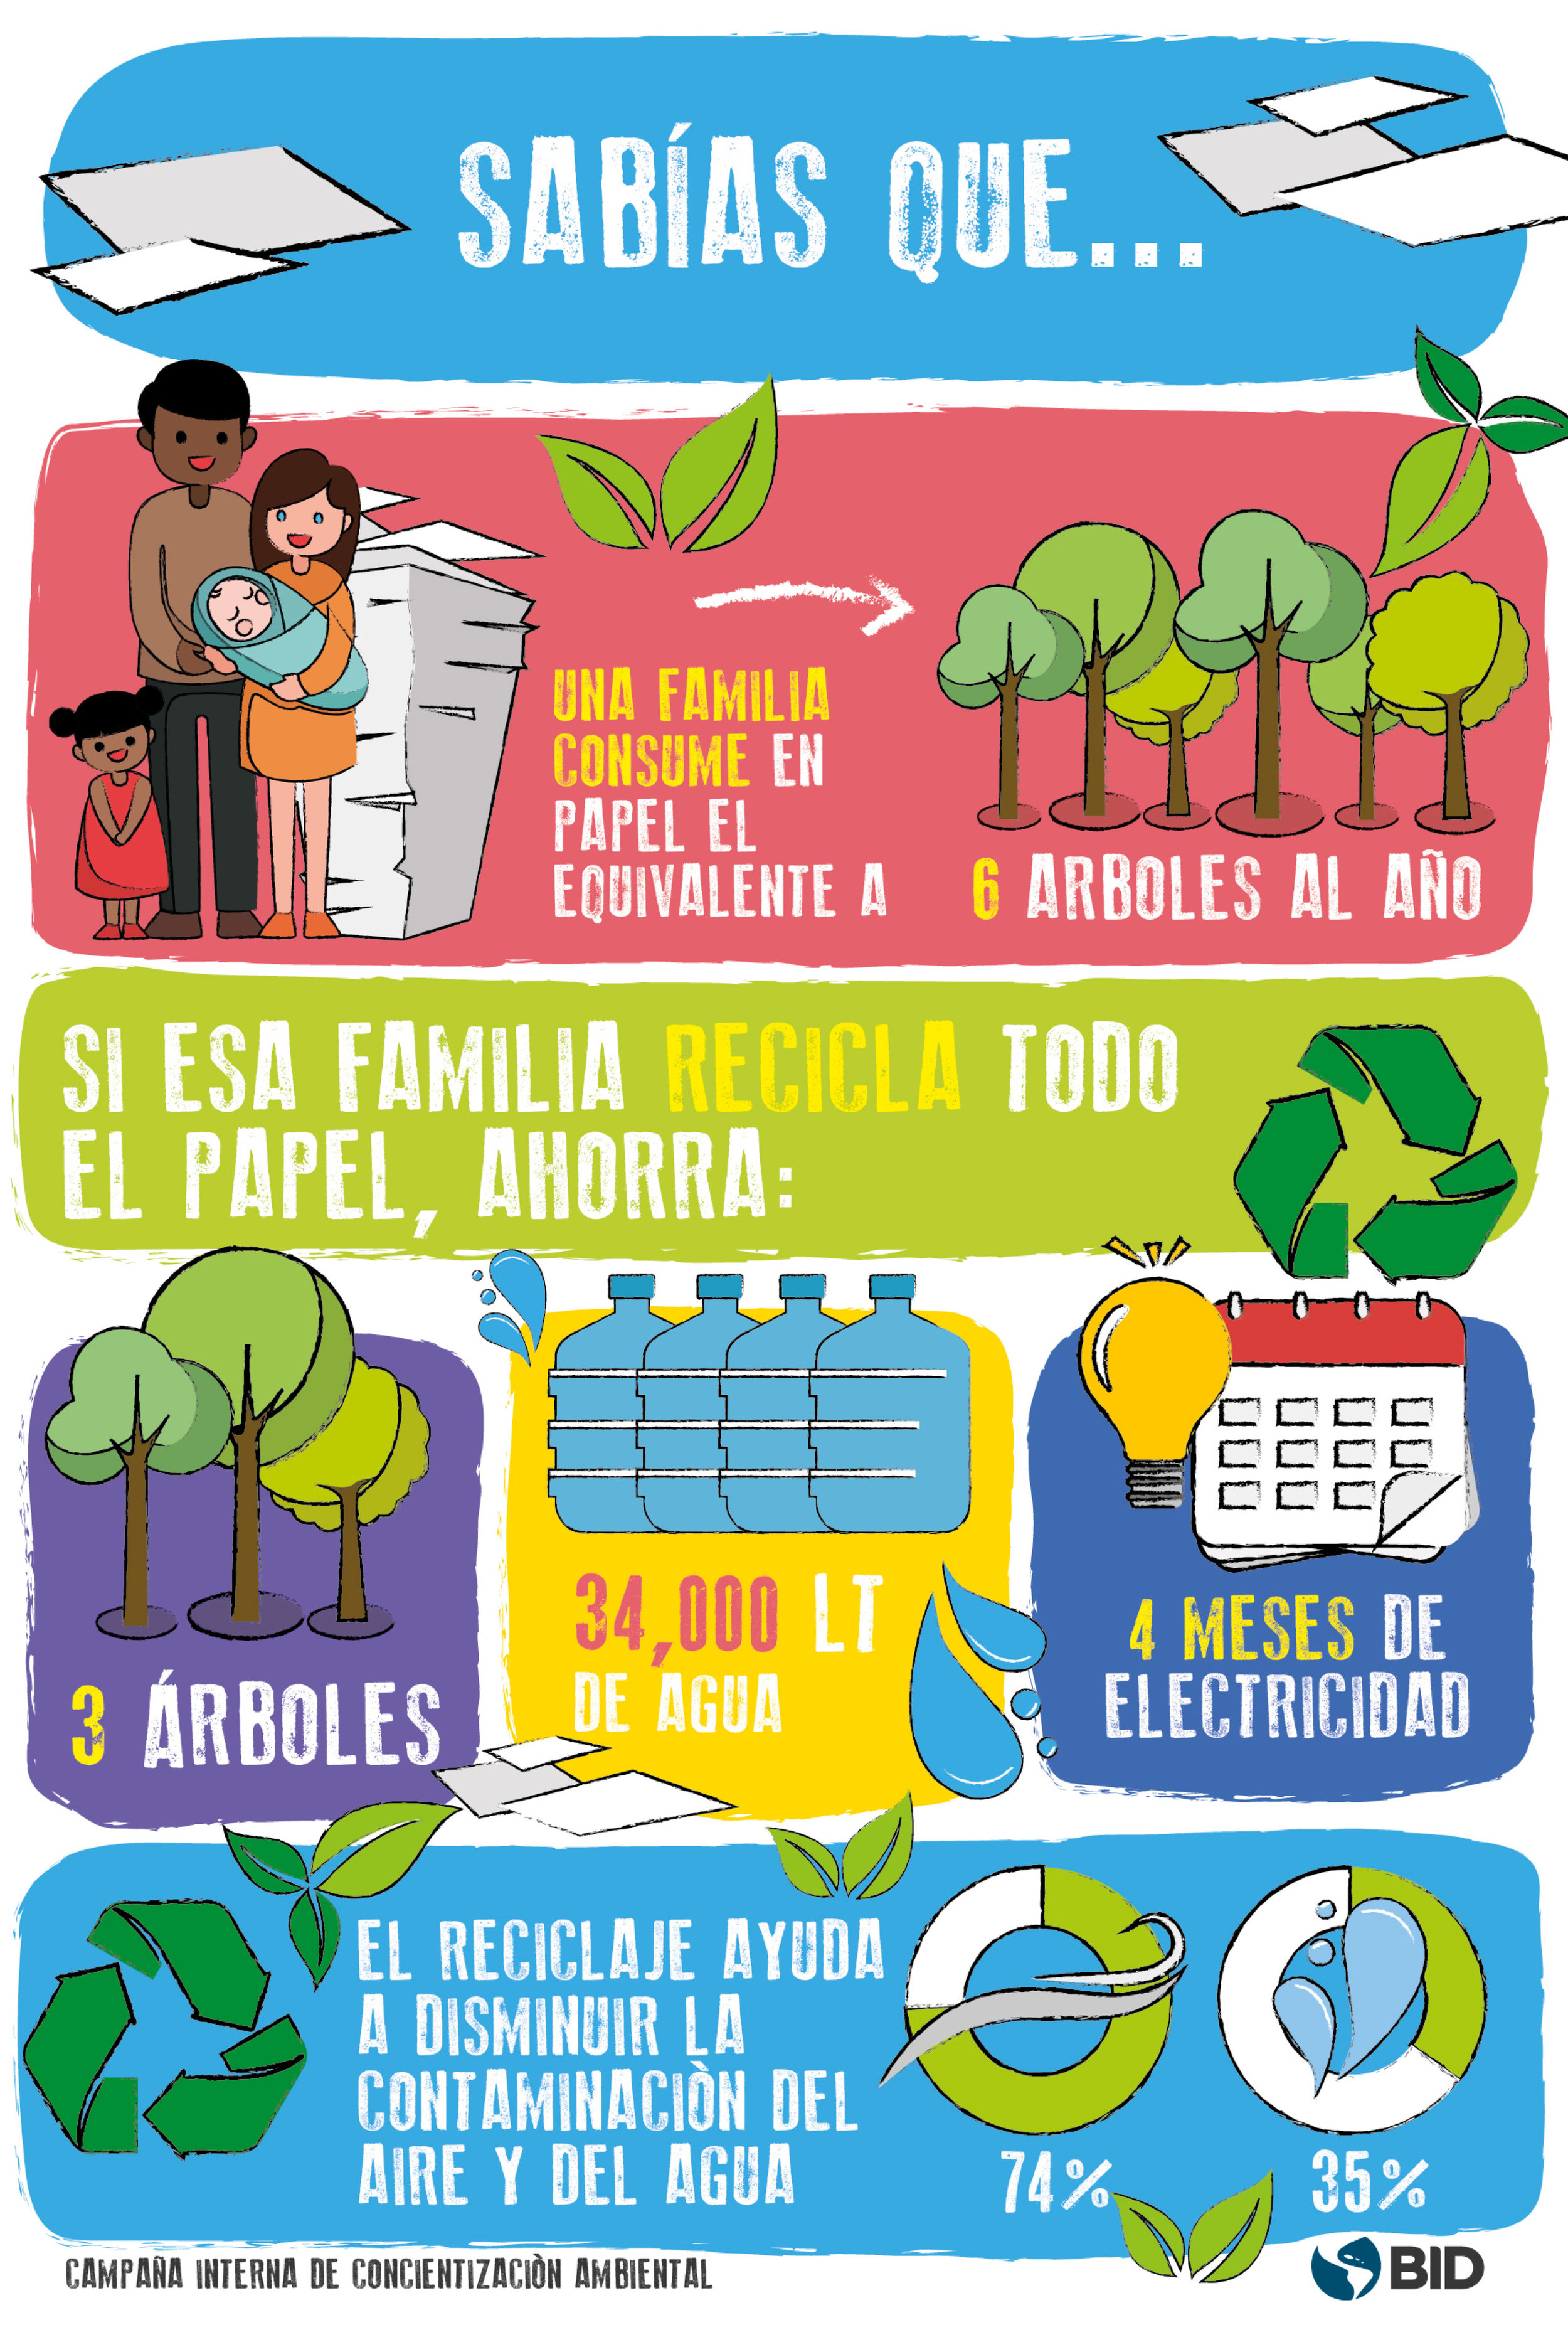
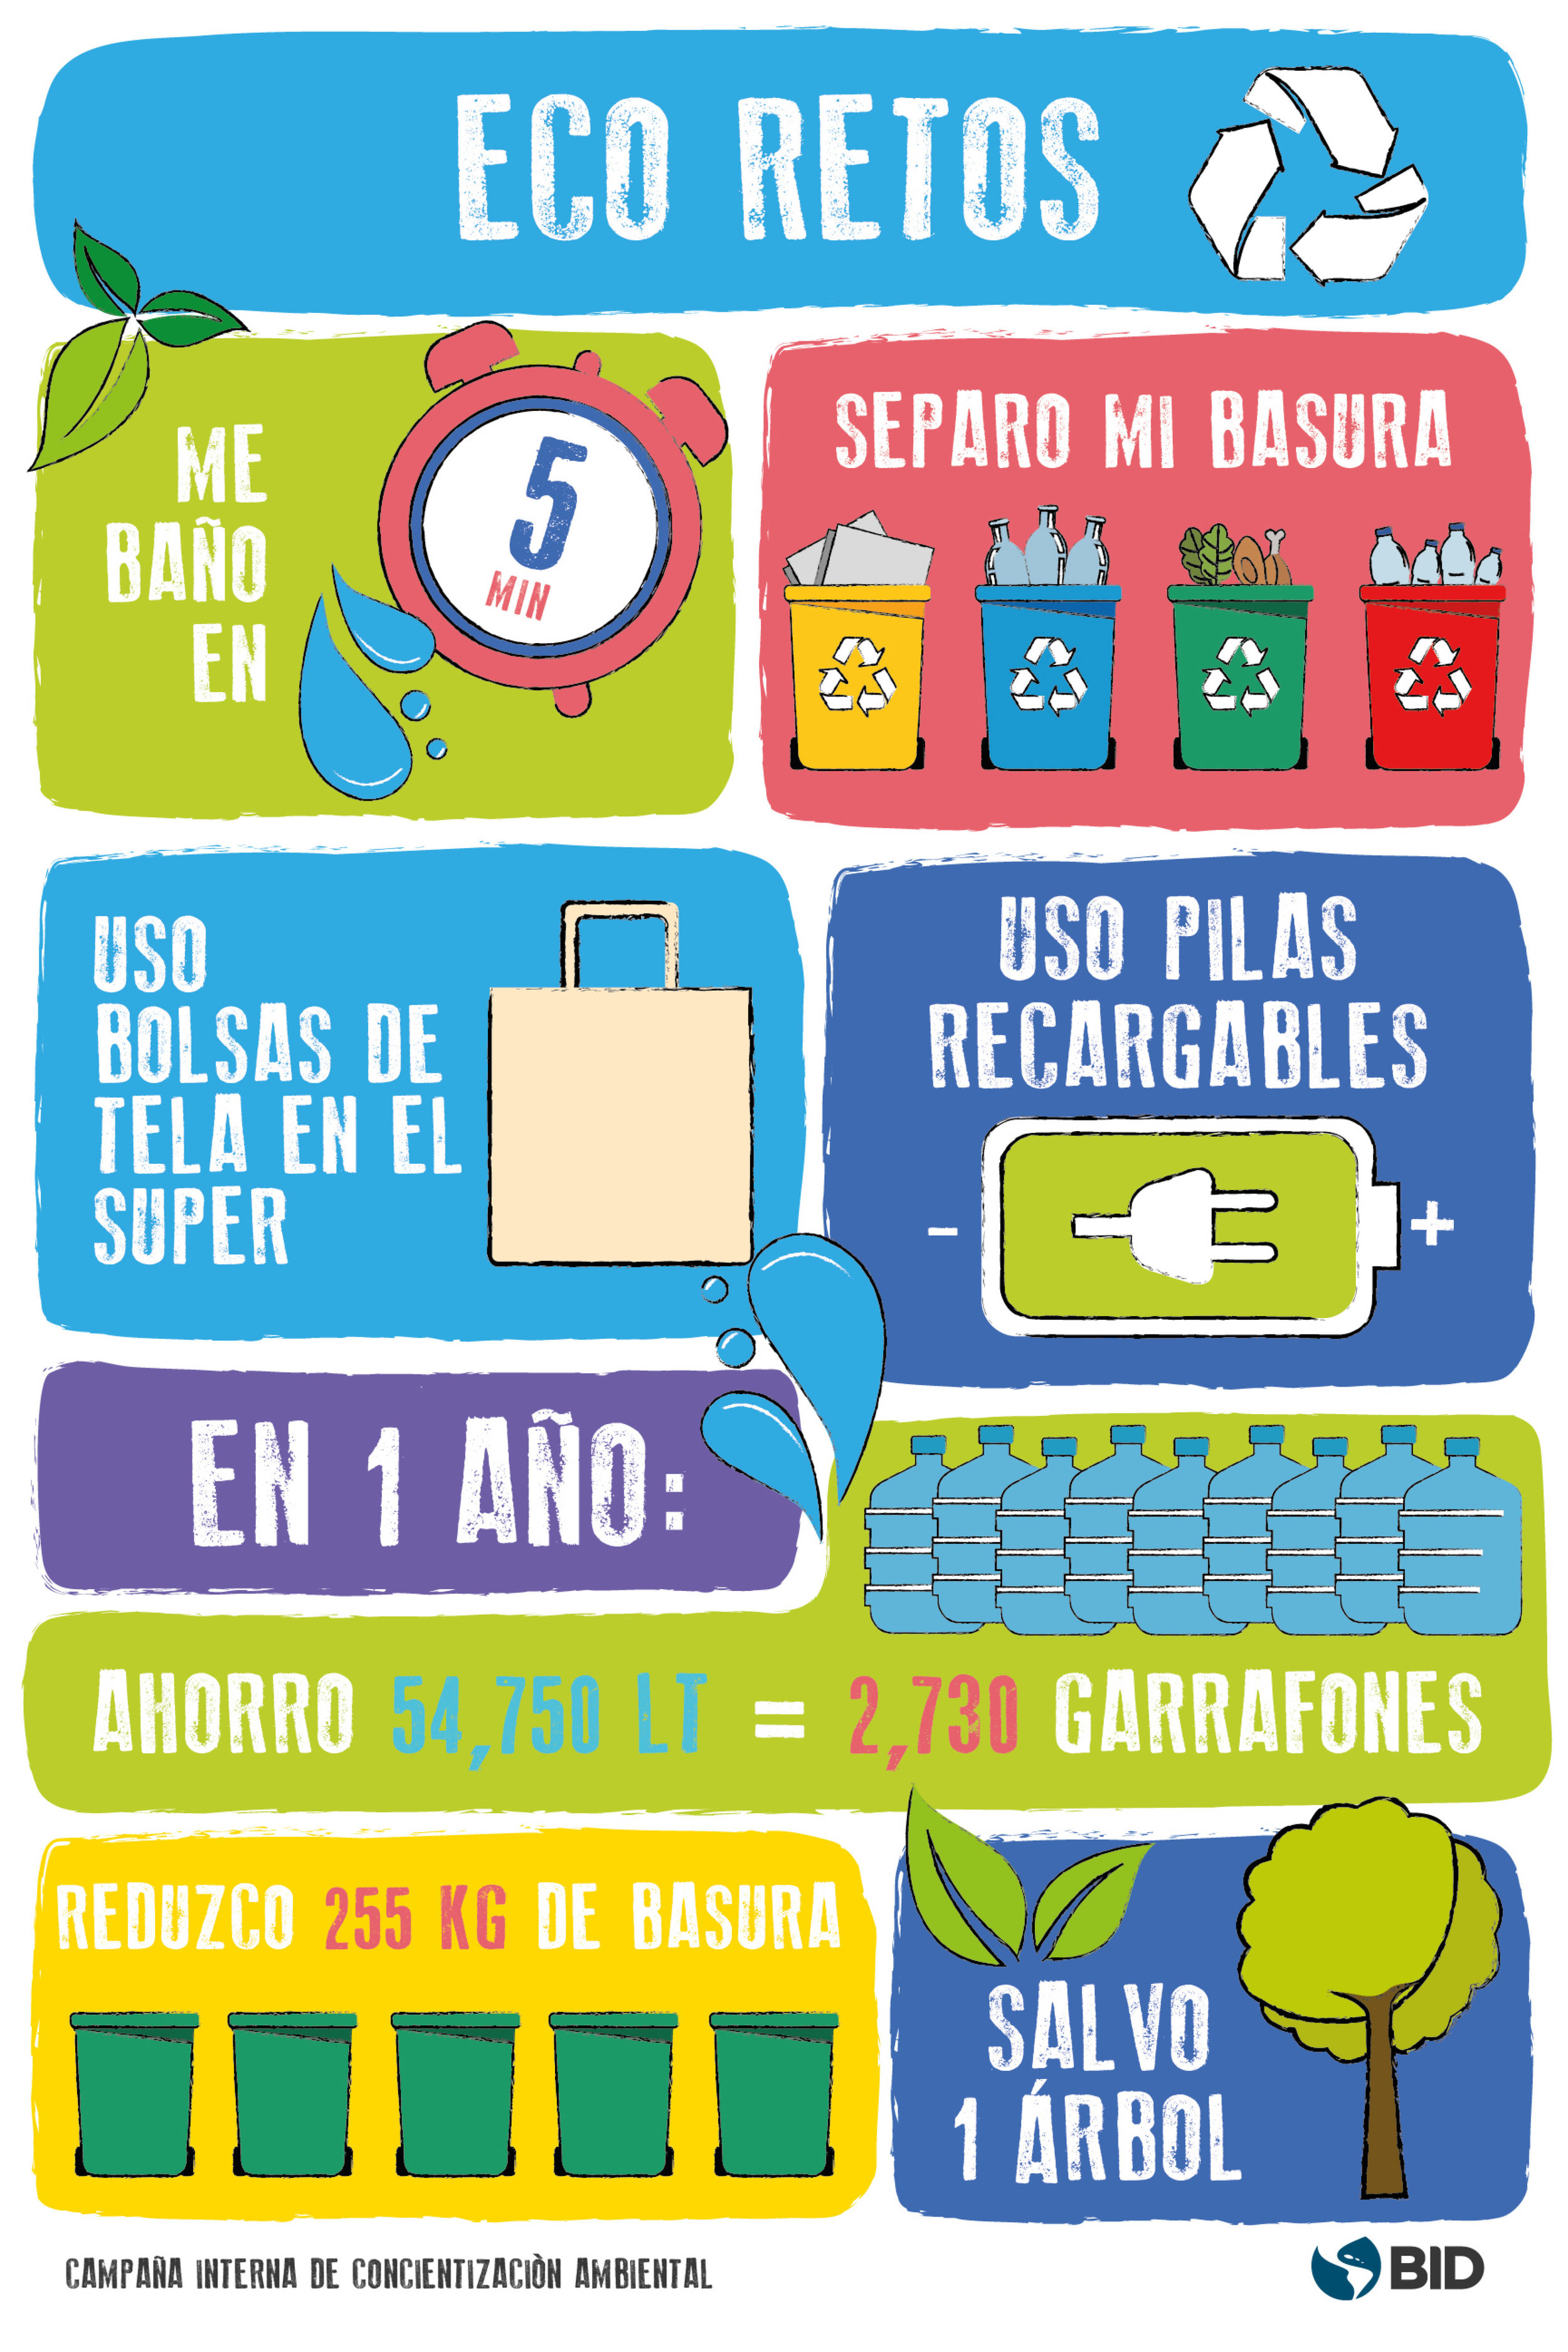
A fun and colorful internal campaign communicating important data about our environment.


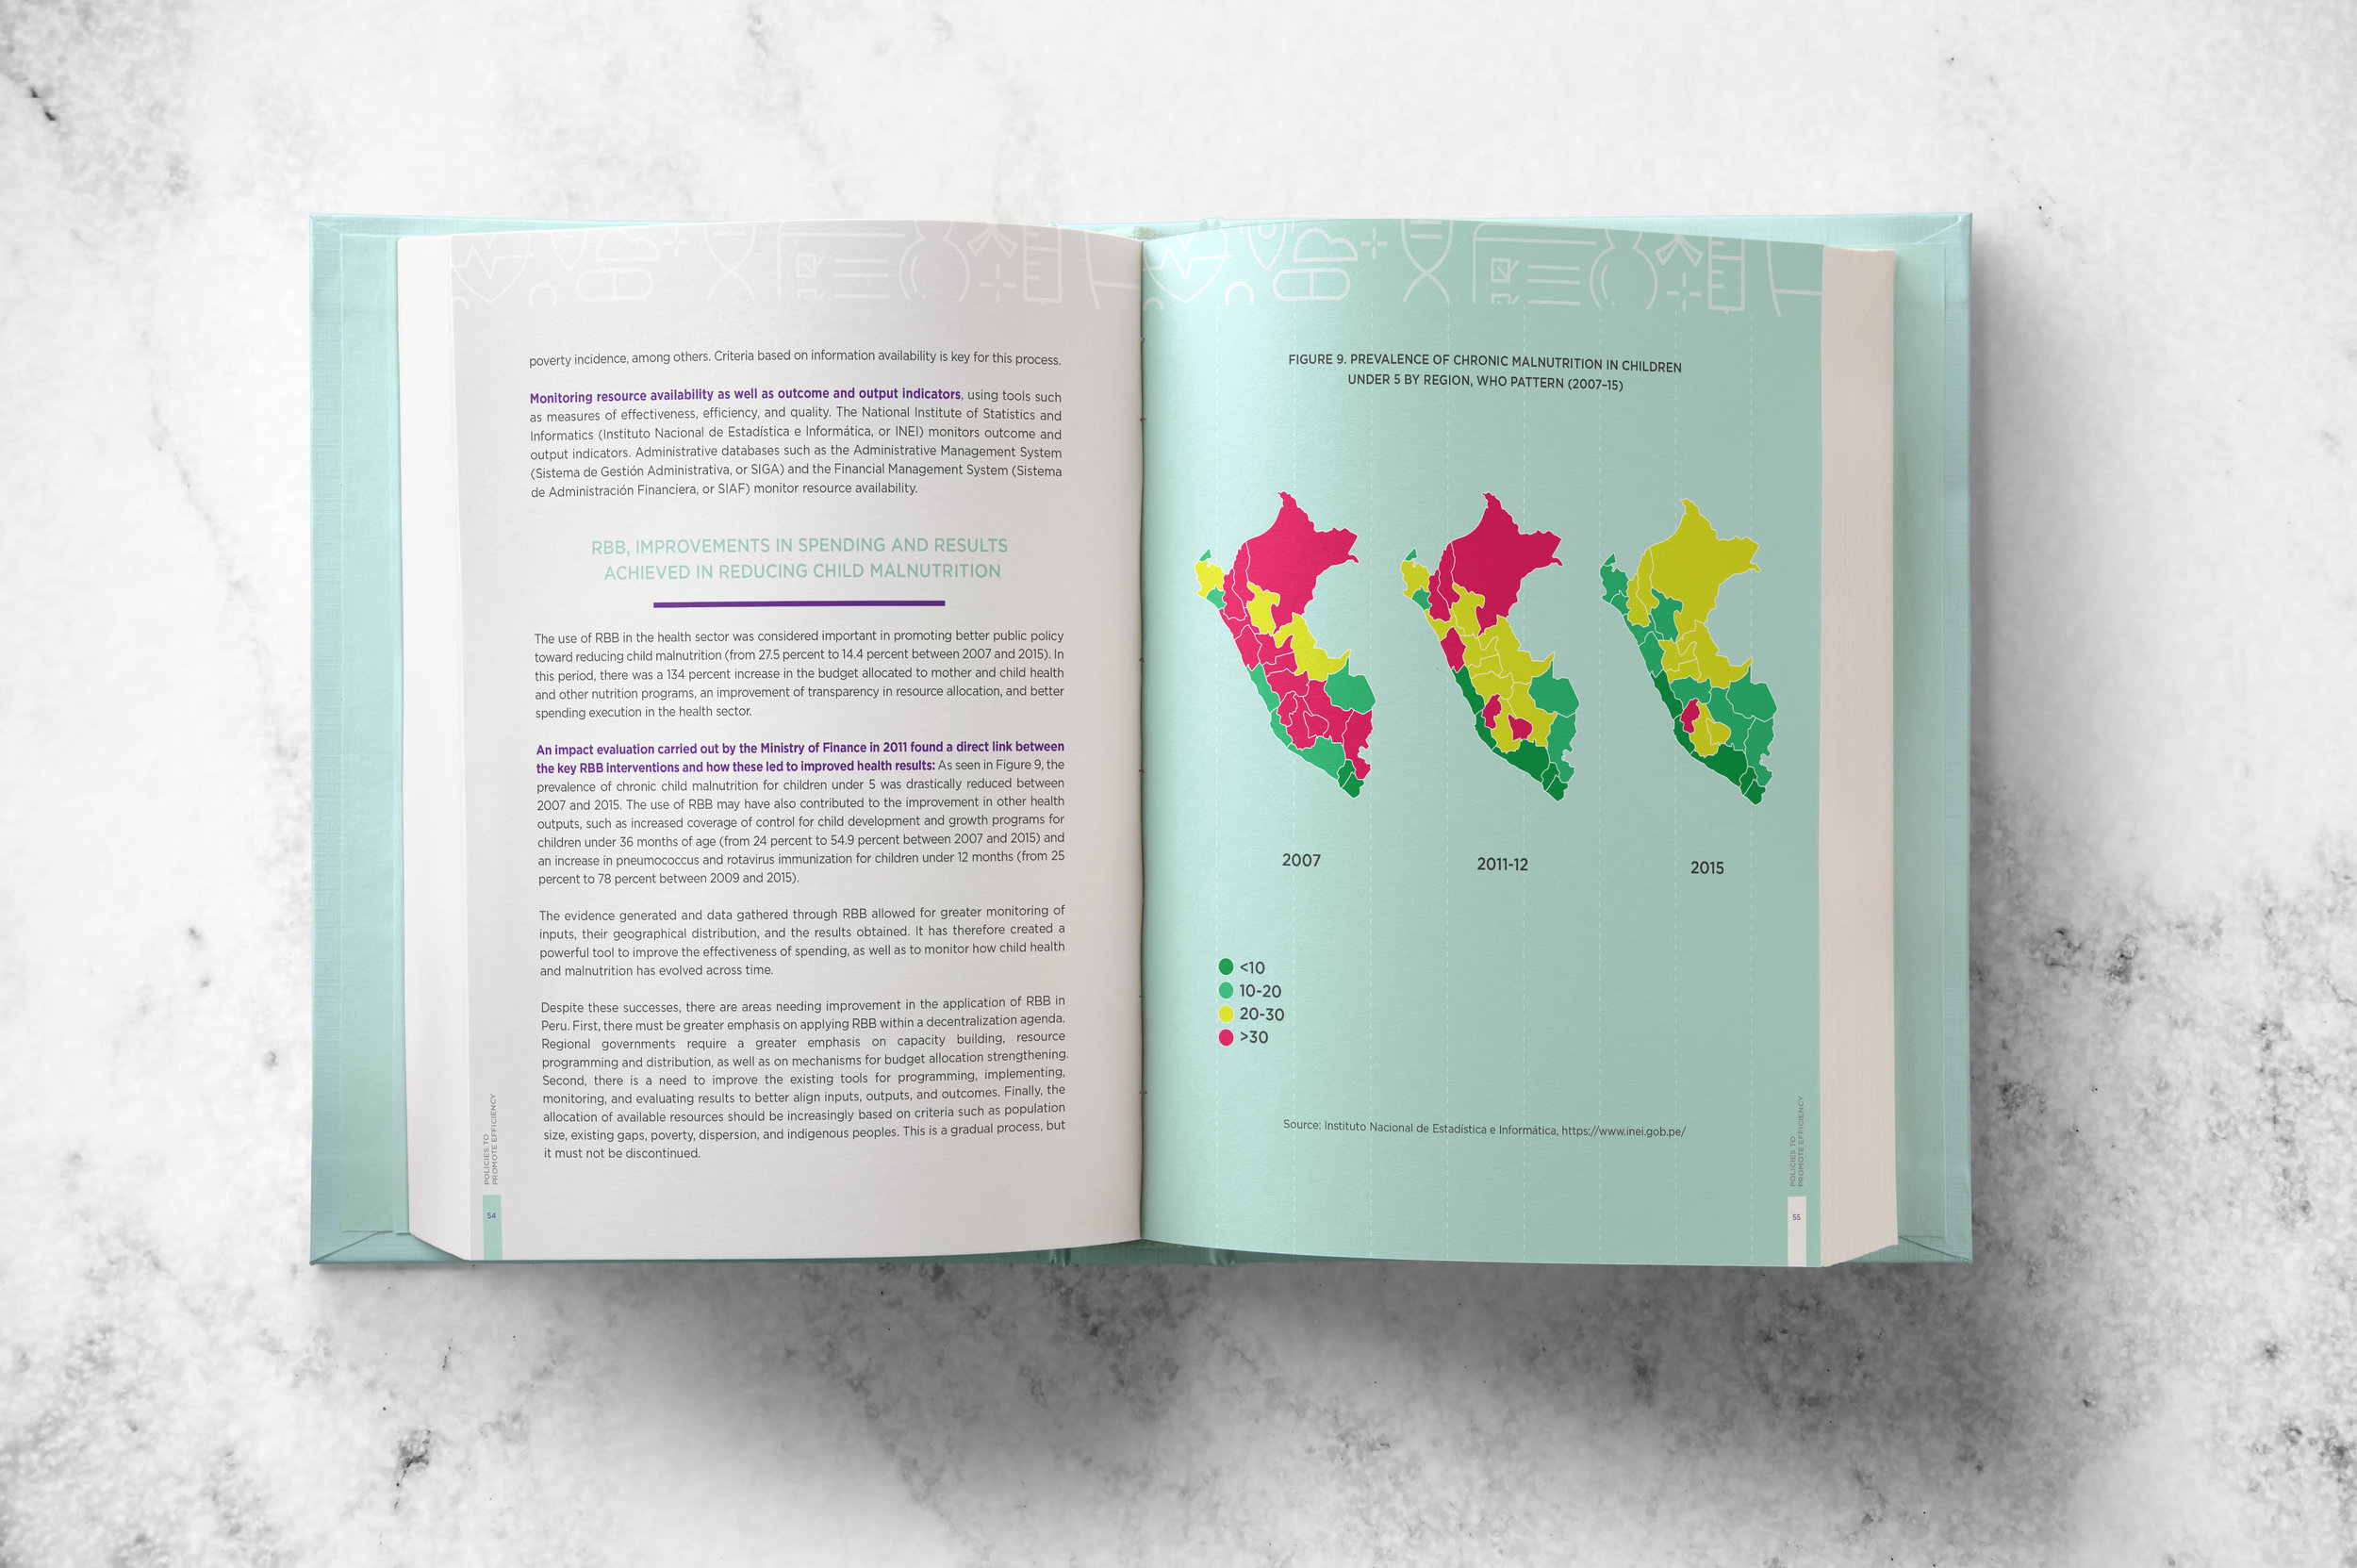
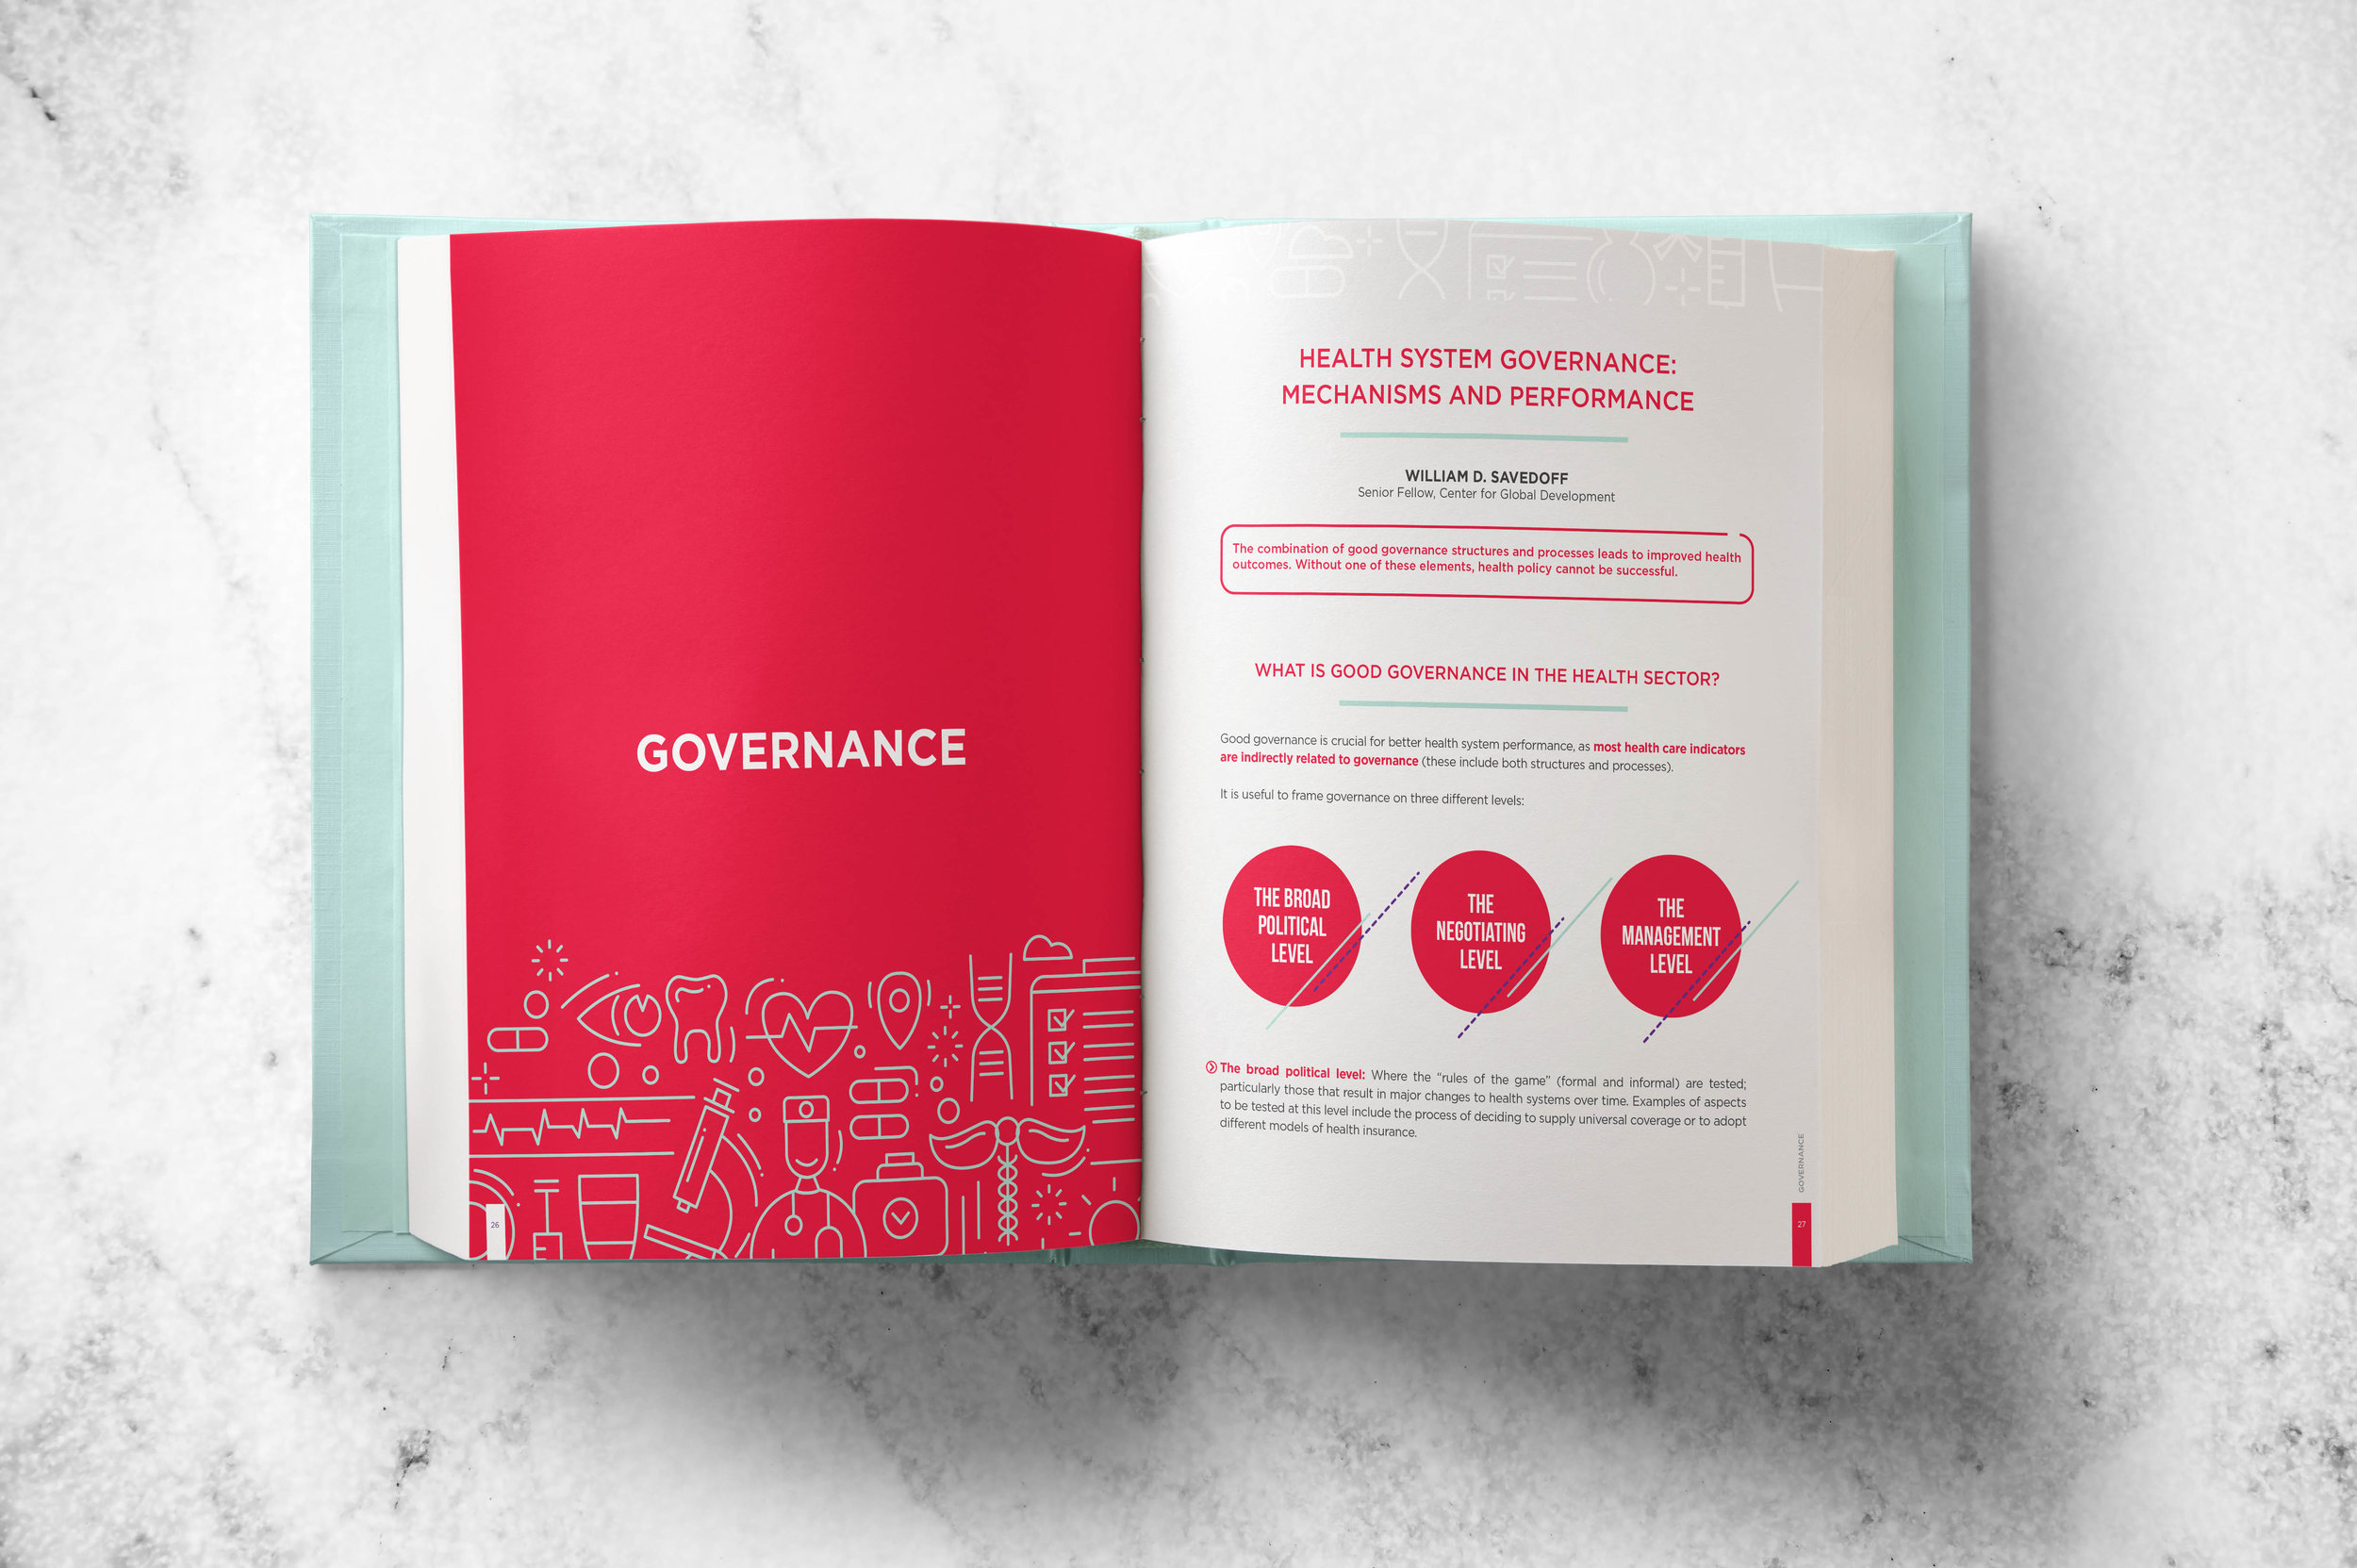
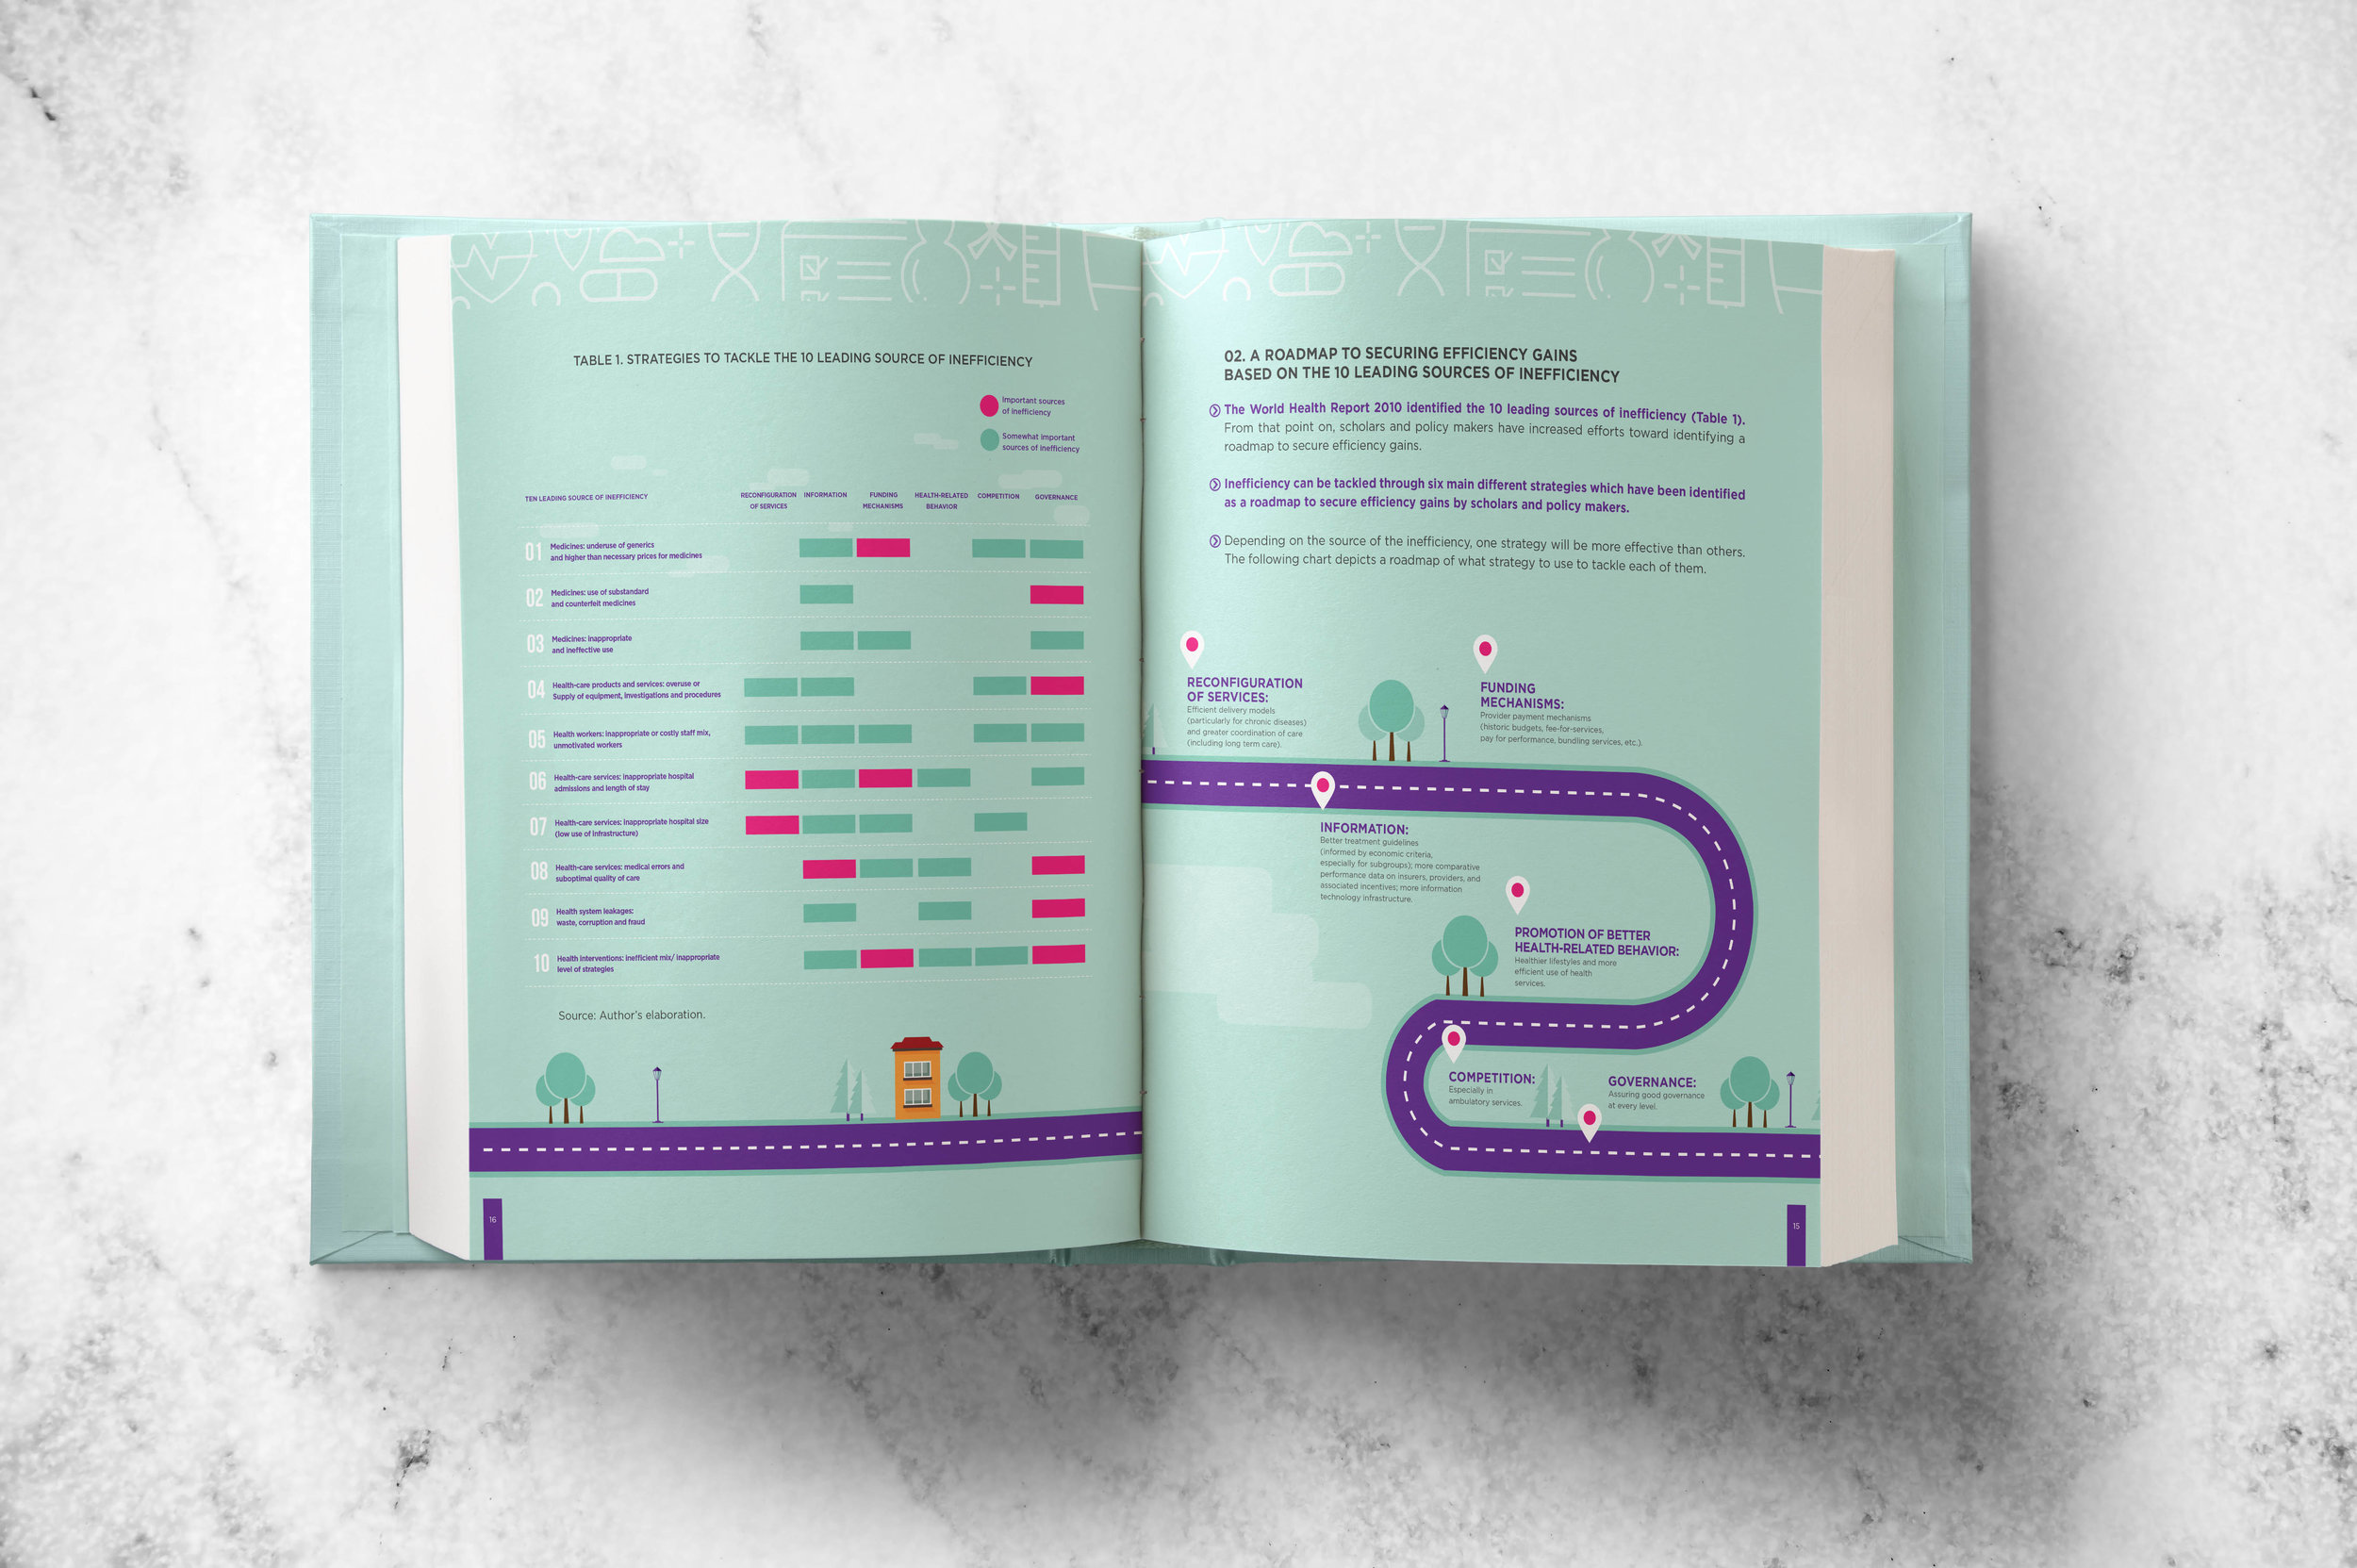
With so many publications being released each day, it is important to make your publication stand out. On of the main ways of doing this is by using lots of visual content such as infographics, charts or figures. That was the idea when together with the Inter-American Development Bank we produced the publication "Public Expenditure Efficiency in Health Care in Latin America and the Caribbean". Take a look to some of the graphics we included on the publication:
Are you thinking about making your publication more visual? What about including some infographics? Check out the infographics section.
The Pan American Health Organization/WHO based in Washington D.C., reached out to the Studio to design an infographic about "Alcohol and Injuries" in different countries of South and Central America. The infographic consisted on a template that we adapted for the following countries: Argentina, Guatemala, Guyana, Mexico, Nicaragua, Panama and Dominican Republic. In the different infographics the audience can see how important alcohol is as a factor in people having accidents. Below are a couple of images as an example.


